Examination of the Santa Clara’s 2010 census tract data shows that the City has clearly identifiable minority majority or near-majority neighborhoods; contradicting the often-repeated statement that the City’s population is homogenous.
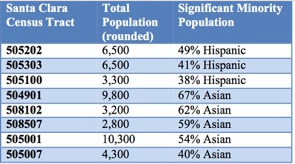
While no one would be surprised to discover Asian majorities and near-majorities north of Highway 101, some may be surprised to learn that there is a clearly identifiable part of Santa Clara whose Hispanic population is between 41 and 49 percent.
That’s the area between El Camino and Highway 101, running from the border of Sunnyvale to the border of San José — Census tracts 505202, 505303 and 505100. That area also has the lowest median household income in the City — $63,000.
Santa Clara’s largest ethnic group is Asians (38 percent), and this is reflected in census blocks both north and south of 101 that are majority or near-majority Asian.
North of 101, majority or near-majority Asian census tracts include: 505001 (bounded by Sunnyvale, San José and Montague Expressway), 504901 (bounded by Montague Expressway, Lafayette St. and Lick Mill Blvd.) and 505007 (bounded by Laurelwood Rd., Montague Expressway and the San José border). Median household incomes in these tracts are between $97,000 and $124,000.
South of 101 there are two census tracts between Lawrence Expressway and the Sunnyvale border, 508102 and 508507, with Asian majorities and median incomes of $134,000 and $121,000 respectively.

The remaining tracts south of El Camino are between 29 and 55 percent white — the majority are slightly more than 50 percent white — with median incomes between $83,000 and $93,000.
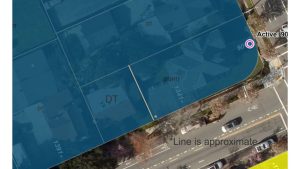
Mapping these demographics against June 2018 Measure A’s segmentation of the City into two districts along El Camino shows a majority of white voters south of El Camino — effectively diluting the votes of Asian voters. The segment north of El Camino has a majority of Asian and high-income voters, effectively drowning the votes of low income and Hispanic voters.
This data is largely from the 2010 census, with some updates between 2013 and 2016. Visualization of census data can be found at statisticalatlas.com.


0 comments