
The above statistic is:
- The result you get if you divide Santa Clara’s employee compensation/benefits ($142,341,810) by the number of full-time employees (924).
- An illustration of the adage, “There are three kinds of lies: lies, damned lies, and statistics.”
- An accurate representation of what the city pays individual employees.
- A factoid in an emerging class war between public employee “haves” and private industry “have-nots.”
- A distraction from a 30 year-long class war prosecuted by the wealthiest one percent against the rest of us.
While answers 2-5 are matters of opinion, answer 1 is indisputable fact. Last month Santa Clara City Council Member Will Kennedy noted that by dividing the city’s total compensation budget by the number of full-time employees, you could theoretically calculate the City’s cost-per-employee.
But while numbers do talk, perceptive people recognize that it’s often hard to know what they’re saying.
Let’s start with the notion of “averages.” They aren’t necessarily representative. For example, Qatar’s “average” per capita income is one of the world’s highest at US$88,559, according to the IMF. However, some 90 percent of the country’s labor force is made up of temporary workers from the developing world. Since the country’s labor laws don’t cover non-citizens, how many Filipino housekeepers in Qatar do you think are making US$89,000 a year?
Analysis of Santa Clara’s budget shows that the City’s distribution of salaries is pretty equitable. The top 20 percent (184) of the city’s employees account for – get ready for it – 20 percent of the City’s total compensation costs.

That’s a far different picture from, say, the U.S. population in general where the top 20 percent garner 50 percent of the income, says the U.S. Census Bureau, and the “average” U.S. CEO, according to recent news reports, earns $11.4 million.
Another perspective is how this number changed over the years. From fiscal year 2009-10 through fiscal year 2011-12, budgeted salaries and benefits increased 1 percent, while budgeted full-time positions dropped by 8 percent.
In 2010-2011, budgeted compensation was $139,116,657 for 946.75 fulltime positions (FTEs), according to information provided by Santa Clara Deputy City Manager Carol McCarthy – yielding an average cost per FTE of $146,941. In 2009-10, that “average” budget number was $140,594,246 and there were 1006.25 funded fulltime positions.
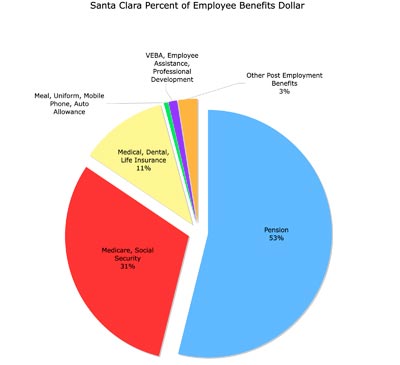
Another way of looking at this number is its composition. Thirty percent ($43,304,297) of budgeted compensation expenses are in the form of benefits, while the remaining 70 percent ($99,037,513) accounts for salary. The largest benefit costs to the city is pension fund (CalPERS) contributions (18%), followed by Medicare (10%), health insurance (4%), Social Security (1%), and post-employment benefits (1%) not covered by these programs.
A 2010 study by Stanford Institute for Economic Policy Research (siepr.stanford.edu) estimates that, on average, local government contributions could reach 60 percent to 65 percent of payroll costs by 2030, as a result of current under-funded liabilities. If this isn’t sufficiently alarming, the study’s author, Stanford Professor of Public Policy Practice Joe Nation, calls this a conservative estimate because, among other things, it understates medical inflation rates.
This estimate paints a Blade Runner future: One where flashy high tech campuses mask ever-declining public services paid for with ever-increasing fees by residents and businesses.
In other words, if the city’s payroll bottom line ($142 million) stays the same, by 2030 we might only be able to afford a city staff of about 400 while the city continues to grow. The planned 49ers football stadium would have to increase Santa Clara tax revenues by more than $80 million a year – about double today’s combined sales and hotel tax revenue – to cover the difference. Currently, 49ers games drive an additional $2.4 million in annual revenue for San Francisco.
For more information about Santa Clara’s budget, visit santaclaraca.gov/index.aspx?page=220. Carolyn Schuk can be reached at cschuk@earthlink.net.


0 comments